时间序列数据是一种重要的结构化数据形式。一般有几种:
- 时间戳:timestamp,特定的时刻
- 固定时期:period,如2010年全年
- 时间间隔:interval,有起始和结束时间戳表示;
- 实验或过程时间,每个时间点都是相对于特定时间的一个变量。
pandas提供一组标准时间序列处理工具和数据算法。
1. 日期和时间数据类型及工具
datetime模块:
In [1]: from datetime import datetime

In [2]: now = datetime.now()

In [3]: now
Out[3]: datetime.datetime(2017, 2, 17, 21, 11, 17, 866138)

In [4]: now.year,now.month,now.day
Out[4]: (2017, 2, 17)
时间差:timedelta
In [5]: delta = datetime(2011,1,7) - datetime(2008,6,24,7,14)

In [6]: delta
Out[6]: datetime.timedelta(926, 60360)

In [7]: delta.days
Out[7]: 926

In [8]: delta.seconds
Out[8]: 60360

In [9]: from datetime import timedelta

In [10]: start = datetime(2008,1,6)

In [11]: start + timedelta(12)  # 传入days
Out[11]: datetime.datetime(2008, 1, 18, 0, 0)

In [12]: start - 2*  timedelta(12)
Out[12]: datetime.datetime(2007, 12, 13, 0, 0)
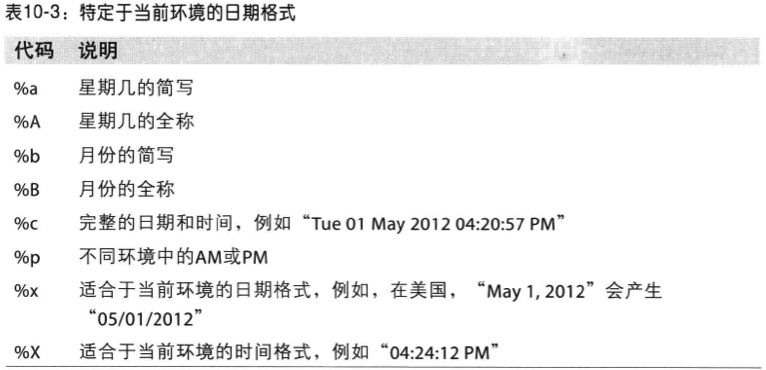
datetime模块数据类型:

1.1 字符串和datetime的相互转换
In [13]: stamp = datetime(2011,1,3)

In [14]: str(stamp)  # 转换为字符串
Out[14]: '2011-01-03 00:00:00'

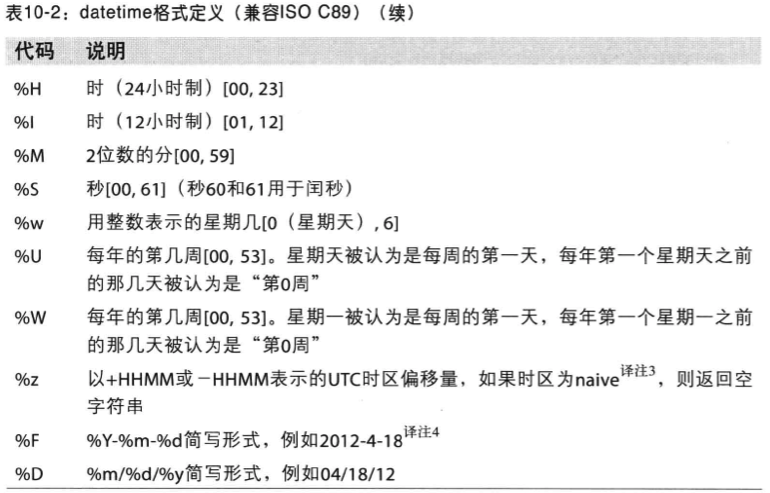
In [15]: stamp.strftime('%Y-%m-%d')  # 格式化为字符串
Out[15]: '2011-01-03'
# 可以转换我们日常用的格式

In [20]: from dateutil.parser import parse

In [21]: parse('2017-01-03')
Out[21]: datetime.datetime(2017, 1, 3, 0, 0)

In [22]: parse('Jan 31, 2017 10:23 PM')
Out[22]: datetime.datetime(2017, 1, 31, 22, 23)

In [23]: parse('02/11/2017')
Out[23]: datetime.datetime(2017, 2, 11, 0, 0)
# pandas模块的时间转换模块

In [25]: datestrs = ['7/6/2014','2/4/2016']

In [26]: import pandas as pd

In [27]: pd.to_datetime(datestrs)
Out[27]: DatetimeIndex(['2014-07-06', '2016-02-04'], dtype='datetime64[ns]', freq=None)

In [28]: idx = pd.to_datetime(datestrs + [None])

In [29]: idx
Out[29]: DatetimeIndex(['2014-07-06', '2016-02-04', 'NaT'], dtype='datetime64[ns]', freq=None)

In [30]: idx[2]
Out[30]: NaT

In [31]: pd.isnull(idx)
Out[31]: array([False, False,  True], dtype=bool)

2. 时间序列基础
In [7]: dates = [(2011,1,1),(2011,2,3),(2011,2,4),(2011,4,23),(2011,4,22),(2011,
   ...: 4,1)]

In [8]: dates = [datetime(*x) for x in dates]

In [14]: ts = Series(np.random.randn(6), index=dates)

# 创建一个以时间戳为index的Series。
In [15]: ts
Out[15]:
2011-01-01    3.627969
2011-02-03    0.731217
2011-02-04    1.178071
2011-04-23   -2.085412
2011-04-22   -0.093829
2011-04-01   -0.157532
dtype: float64

In [16]: type(ts)
Out[16]: pandas.core.series.Series

In [17]: ts.index
Out[17]:
DatetimeIndex(['2011-01-01', '2011-02-03', '2011-02-04', '2011-04-23',
               '2011-04-22', '2011-04-01'],
              dtype='datetime64[ns]', freq=None)

# 和普通的Series一样,可以做Series相加
In [19]: ts + ts[::2]

2011-01-01    7.255939
2011-02-03         NaN
2011-02-04    2.356142
2011-04-01         NaN
2011-04-22   -0.187658
2011-04-23         NaN
dtype: float64

# 时间序列的index类型为datetime64,单位是纳秒
In [20]: ts.index.dtype
Out[20]: dtype('<M8[ns]')

In [21]: stamp = ts.index[0]

In [22]: stamp
Out[22]: Timestamp('2011-01-01 00:00:00')
2.1 索引、选取和子集的构造
索引
# 可以使用datetime格式的索引
In [24]: stamp = ts.index[2]

In [25]: ts[stamp]
Out[25]: 1.1780707665960897

# 也可以使用常用日期格式的字符串类型作为索引。
In [27]: ts['01/01/2011']
Out[27]:
2011-01-01    3.627969
dtype: float64

In [28]: ts['20110101']
Out[28]:
2011-01-01    3.627969
dtype: float64
切片
# 通过日期来直接切片,但是只对Series有效。
# pd.date_range可以将创建时间序列
In [29]: longer_ts = Series(np.random.randn(1000), index=pd.date_range('1/1/2017
    ...: ',periods=1000))

In [30]: longer_ts[:5]
Out[30]:
2017-01-01    0.311815
2017-01-02   -0.424868
2017-01-03    0.198069
2017-01-04    1.011494
2017-01-05   -0.312494
Freq: D, dtype: float64

In [31]: longer_ts[-5:]
Out[31]:
2019-09-23   -0.637869
2019-09-24    0.721613
2019-09-25   -0.914481
2019-09-26    0.036966
2019-09-27    0.677846
Freq: D, dtype: float64

# 获取2017-2月的所有数据
In [32]: longer_ts['2017-2']
Out[32]:
2017-02-01    1.258390
2017-02-02    0.606618
2017-02-03    0.927122
2017-02-04    0.761009
...
2017-02-23   -1.039703
2017-02-24    0.478075
2017-02-25   -0.328411
2017-02-26   -1.019641
2017-02-27    0.186212
2017-02-28   -1.466734
Freq: D, dtype: float64

# 单日数据
In [33]: longer_ts['2017-2-3']
Out[33]: 0.92712152603736908

# 年数据
In [34]: longer_ts['2017'][:5]
Out[34]:
2017-01-01    0.311815
2017-01-02   -0.424868
2017-01-03    0.198069
2017-01-04    1.011494
2017-01-05   -0.312494
Freq: D, dtype: float64


也可以通过不存在的时间戳对Series进行切片。
2.带有重复索引的时间序列
In [35]: dates = pd.DatetimeIndex(['1/1/2000','1/2/2000','1/2/2000','1/2/2000','
    ...: 1/3/2000'])

In [36]: dup_ts = Series(np.arange(5), index=dates)

In [37]: dup_ts
Out[37]:
2000-01-01    0
2000-01-02    1
2000-01-02    2
2000-01-02    3
2000-01-03    4
dtype: int64

# 查看索引是否重复
In [40]: dup_ts.index.is_unique
Out[40]: False

In [41]: dup_ts['1/2/2000']  # 重复, 数组
Out[41]:
2000-01-02    1
2000-01-02    2
2000-01-02    3
dtype: int64

In [42]: dup_ts['1/3/2000']  # 不重复,标量
Out[42]: 4
In [43]: grouped = dup_ts.groupby(level=0)

In [44]: grouped.mean()
Out[44]:
2000-01-01    0
2000-01-02    2
2000-01-03    4
dtype: int64

In [45]: grouped.count()
Out[45]:
2000-01-01    1
2000-01-02    3
2000-01-03    1
dtype: int64
3. 日期的范围、频率及移动
pandas中的时间序列一般是不规则的,没有固定的频率。但是通常需要一某种频率对序列进行分析, 幸运的是pandas有一套工具,帮助我们解决这些问题。
resample
In [49]: dates = pd.DatetimeIndex(['2000-01-02','2000-01-05','2000-01-07','2000-
    ...: 01-08','2000-01-10','2000-01-12'])

In [50]: ts = Series(np.random.randn(6), index=dates)

In [51]: ts
Out[51]:
2000-01-02    0.124049
2000-01-05   -0.840846
2000-01-07   -0.051655
2000-01-08   -0.603824
2000-01-10    0.467815
2000-01-12   -0.201388
dtype: float64

In [52]: ts.resample('D')
Out[52]: /Users/yangfeilong/anaconda/lib/python2.7/site-packages/IPython/utils/dir2.py:65:
 FutureWarning: .resample() is now a deferred operation
use .resample(...).mean() instead of .resample(...)
  canary = getattr(obj, '_ipython_canary_method_should_not_exist_', None)
DatetimeIndexResampler [freq=<Day>, axis=0, closed=left, label=left,
convention=start, base=0]

In [53]: ts.resample('D').mean()   # 填充空日期
Out[53]:
2000-01-02    0.124049
2000-01-03         NaN
2000-01-04         NaN
2000-01-05   -0.840846
2000-01-06         NaN
2000-01-07   -0.051655
2000-01-08   -0.603824
2000-01-09         NaN
2000-01-10    0.467815
2000-01-11         NaN
2000-01-12   -0.201388
Freq: D, dtype: float64
3.1 生成日期范围
pandas.date_range可以生成指定长度的日期范围。
In [54]: index = pd.date_range('4/1/2017','6/1/2017') # 生成一段时间的序列,默认00:00

In [55]: index
Out[55]:
DatetimeIndex(['2017-04-01', '2017-04-02', '2017-04-03', '2017-04-04',
               '2017-04-05', '2017-04-06', '2017-04-07', '2017-04-08',
               '2017-04-09', '2017-04-10', '2017-04-11', '2017-04-12',
               '2017-04-13', '2017-04-14', '2017-04-15', '2017-04-16',
               '2017-04-17', '2017-04-18', '2017-04-19', '2017-04-20',
               '2017-04-21', '2017-04-22', '2017-04-23', '2017-04-24',
               '2017-04-25', '2017-04-26', '2017-04-27', '2017-04-28',
               '2017-04-29', '2017-04-30', '2017-05-01', '2017-05-02',
               '2017-05-03', '2017-05-04', '2017-05-05', '2017-05-06',
               '2017-05-07', '2017-05-08', '2017-05-09', '2017-05-10',
               '2017-05-11', '2017-05-12', '2017-05-13', '2017-05-14',
               '2017-05-15', '2017-05-16', '2017-05-17', '2017-05-18',
               '2017-05-19', '2017-05-20', '2017-05-21', '2017-05-22',
               '2017-05-23', '2017-05-24', '2017-05-25', '2017-05-26',
               '2017-05-27', '2017-05-28', '2017-05-29', '2017-05-30',
               '2017-05-31', '2017-06-01'],
              dtype='datetime64[ns]', freq='D')

In [56]: pd.date_range(start='4/1/2017',periods=20)  # 指定长度
Out[56]:
DatetimeIndex(['2017-04-01', '2017-04-02', '2017-04-03', '2017-04-04',
               '2017-04-05', '2017-04-06', '2017-04-07', '2017-04-08',
               '2017-04-09', '2017-04-10', '2017-04-11', '2017-04-12',
               '2017-04-13', '2017-04-14', '2017-04-15', '2017-04-16',
               '2017-04-17', '2017-04-18', '2017-04-19', '2017-04-20'],
              dtype='datetime64[ns]', freq='D')

In [57]: pd.date_range(end='4/1/2017',periods=20)  # 指定结束日期
Out[57]:
DatetimeIndex(['2017-03-13', '2017-03-14', '2017-03-15', '2017-03-16',
               '2017-03-17', '2017-03-18', '2017-03-19', '2017-03-20',
               '2017-03-21', '2017-03-22', '2017-03-23', '2017-03-24',
               '2017-03-25', '2017-03-26', '2017-03-27', '2017-03-28',
               '2017-03-29', '2017-03-30', '2017-03-31', '2017-04-01'],
              dtype='datetime64[ns]', freq='D')

In [58]: pd.date_range('4/1/2017','6/1/2017',freq='BM')  # 指定频率,为月末工作日
Out[58]: DatetimeIndex(['2017-04-28', '2017-05-31'], dtype='datetime64[ns]', freq='BM')

In [59]: pd.date_range('5/3/2017 12:34:12',periods=5) # 默认时分秒 不变
Out[59]:
DatetimeIndex(['2017-05-03 12:34:12', '2017-05-04 12:34:12',
               '2017-05-05 12:34:12', '2017-05-06 12:34:12',
               '2017-05-07 12:34:12'],
              dtype='datetime64[ns]', freq='D')

In [60]: pd.date_range('5/3/2017 12:34:12',periods=5, normalize=True)  # 可以改到0时
Out[60]:
DatetimeIndex(['2017-05-03', '2017-05-04', '2017-05-05', '2017-05-06',
               '2017-05-07'],
              dtype='datetime64[ns]', freq='D')
3.2 频率和日期偏移量
In [61]: # 可以显式的创建频率使用的日期偏离

In [62]: from pandas.tseries.offsets import Hour

In [63]: four_hours = Hour(4)

In [64]: four_hours
Out[64]: <4 * Hours>

In [65]: # 也可以直接使用4H之类的字符串直接指定

In [66]: pd.date_range('1/1/2017', '1/3/2017 22:25',freq='4H')
Out[66]:
DatetimeIndex(['2017-01-01 00:00:00', '2017-01-01 04:00:00',
               '2017-01-01 08:00:00', '2017-01-01 12:00:00',
               '2017-01-01 16:00:00', '2017-01-01 20:00:00',
               '2017-01-02 00:00:00', '2017-01-02 04:00:00',
               '2017-01-02 08:00:00', '2017-01-02 12:00:00',
               '2017-01-02 16:00:00', '2017-01-02 20:00:00',
               '2017-01-03 00:00:00', '2017-01-03 04:00:00',
               '2017-01-03 08:00:00', '2017-01-03 12:00:00',
               '2017-01-03 16:00:00', '2017-01-03 20:00:00'],
              dtype='datetime64[ns]', freq='4H')

In [67]: pd.date_range('1/1/2017', '1/3/2017 22:25',freq=four_hours)
Out[67]:
DatetimeIndex(['2017-01-01 00:00:00', '2017-01-01 04:00:00',
               '2017-01-01 08:00:00', '2017-01-01 12:00:00',
               '2017-01-01 16:00:00', '2017-01-01 20:00:00',
               '2017-01-02 00:00:00', '2017-01-02 04:00:00',
               '2017-01-02 08:00:00', '2017-01-02 12:00:00',
               '2017-01-02 16:00:00', '2017-01-02 20:00:00',
               '2017-01-03 00:00:00', '2017-01-03 04:00:00',
               '2017-01-03 08:00:00', '2017-01-03 12:00:00',
               '2017-01-03 16:00:00', '2017-01-03 20:00:00'],
              dtype='datetime64[ns]', freq='4H')


In [68]: from pandas.tseries.offsets import Hour,Minute

# 可以通过相加获得指定长度的时间偏移
In [69]: Hour(1) + Minute(30)
Out[69]: <90 * Minutes>

# 也可以用更简单的字符串
In [70]: pd.date_range('1/1/2017',periods=3, freq='1h30min')
Out[70]:
DatetimeIndex(['2017-01-01 00:00:00', '2017-01-01 01:30:00',
               '2017-01-01 03:00:00'],
              dtype='datetime64[ns]', freq='90T')
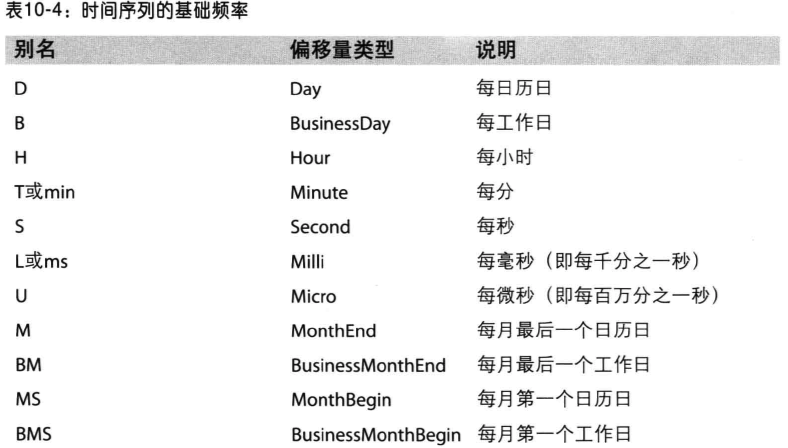
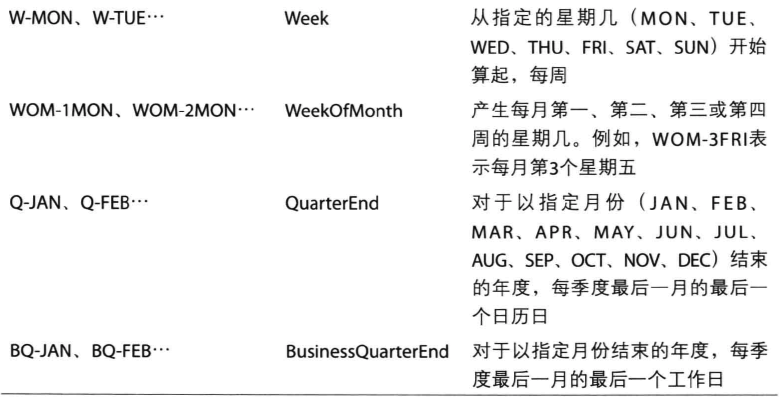
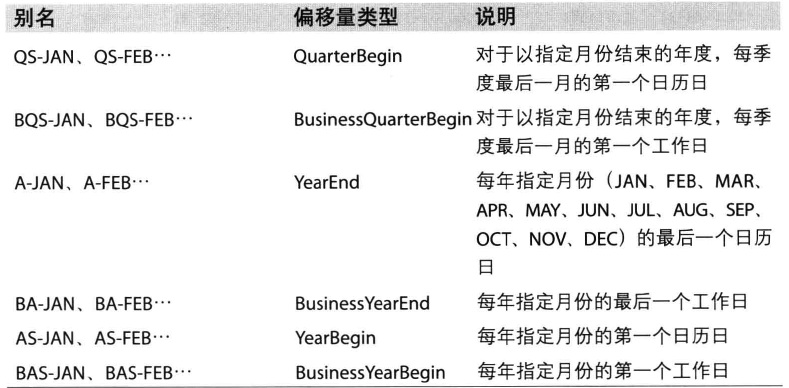
有些偏移是不规律的,pandas自带了一些日期偏移量,供大家使用。如下表:
3.3 移动(超前或滞后)数据
shift沿着时间轴将数据进行前移或后移。
In [71]: ts = Series(np.random.randn(4), index=pd.date_range('1/1/2017',periods=
    ...: 4, freq='M'))

In [72]: ts
Out[72]:
2017-01-31   -0.080326
2017-02-28    0.432715
2017-03-31    1.094710
2017-04-30   -1.024227
Freq: M, dtype: float64


In [73]: ts.shift(2)  # 将数据超前
Out[73]:
2017-01-31         NaN
2017-02-28         NaN
2017-03-31   -0.080326
2017-04-30    0.432715
Freq: M, dtype: float64

In [74]: ts.shift(-2)  # 数据滞后
Out[74]:
2017-01-31    1.094710
2017-02-28   -1.024227
2017-03-31         NaN
2017-04-30         NaN
Freq: M, dtype: float64

# 计算本月相对上月的增长率
In [76]: ts/ts.shift(1) - 1
Out[76]:
2017-01-31         NaN
2017-02-28   -6.386994
2017-03-31    1.529866
2017-04-30   -1.935615
Freq: M, dtype: float64

# 加上freq后,日期增长,数据位置行不变
In [78]: ts.shift(2, freq='M')
Out[78]:
2017-03-31   -0.080326
2017-04-30    0.432715
2017-05-31    1.094710
2017-06-30   -1.024227
Freq: M, dtype: float64


# 当然还能加上其他频率,会更加灵活

In [79]: ts.shift(3, freq='D')
Out[79]:
2017-02-03   -0.080326
2017-03-03    0.432715
2017-04-03    1.094710
2017-05-03   -1.024227
dtype: float64

In [80]: ts.shift(1, freq='3D')
Out[80]:
2017-02-03   -0.080326
2017-03-03    0.432715
2017-04-03    1.094710
2017-05-03   -1.024227
dtype: float64
日期位移
# day:偏移日期,可传入数量
# MonthEnd:偏移到月末
In [81]: from pandas.tseries.offsets import Day,MonthEnd

In [82]: now = datetime(2017,2,18)

In [83]: now + 3 * Day() # 通过+-直接计算日期
Out[83]: Timestamp('2017-02-21 00:00:00')

In [84]: now + MonthEnd() # 偏移到月末
Out[84]: Timestamp('2017-02-28 00:00:00')

In [85]: now + MonthEnd(1) # 下月末
Out[85]: Timestamp('2017-02-28 00:00:00')

In [86]: offset = MonthEnd()

In [87]: offset.rollforward(now)  # 滚到本月末
Out[87]: Timestamp('2017-02-28 00:00:00')

In [88]: offset.rollback(now)  # 滚到上月末
Out[88]: Timestamp('2017-01-31 00:00:00')

In [90]: ts = Series(np.random.randn(20),index=pd.date_range('2/18/2017',periods
    ...: =20, freq='4d'))

In [91]: ts.groupby(offset.rollforward).mean()  # 每个日期滚到月末后分组,并求平均值
Out[91]:
2017-02-28   -0.536243
2017-03-31   -0.373386
2017-04-30    0.131691
2017-05-31    1.775742
dtype: float64

In [92]: ts.resample('M',how='mean')  # resample更易
/Users/yangfeilong/anaconda/bin/ipython:1: FutureWarning: how in .resample() is deprecated
the new syntax is .resample(...).mean()
  #!/bin/bash /Users/yangfeilong/anaconda/bin/python.app
Out[92]:
2017-02-28   -0.536243
2017-03-31   -0.373386
2017-04-30    0.131691
2017-05-31    1.775742
Freq: M, dtype: float64

In [93]: ts.resample('M').mean()
Out[93]:
2017-02-28   -0.536243
2017-03-31   -0.373386
2017-04-30    0.131691
2017-05-31    1.775742
Freq: M, dtype: float64
4. 时区处理
时区处理很麻烦,一般就以UTC来处理。 UTC为协调世界时,是格林尼治时间的替代者,目前已经是国际标准。
In [1]: import pytz

In [4]: pytz.common_timezones[-5:]
Out[4]: ['US/Eastern', 'US/Hawaii', 'US/Mountain', 'US/Pacific', 'UTC']

In [5]: tz = pytz.timezone('Asia/Shanghai')

In [6]: tz
Out[6]: <DstTzInfo 'Asia/Shanghai' LMT+8:06:00 STD>
4.1 本地化和转换
默认情况下,pandas时间序列是单纯(naive)时区的。
In [11]: rng = pd.date_range('2/19/2017 9:30', periods=4, freq='D')

In [12]: ts = Series(np.random.randn(4),index=rng)

In [13]: ts.index.tz  # 结果为空

In [14]: ts
Out[14]:
2017-02-19 09:30:00    0.530722
2017-02-20 09:30:00    1.459262
2017-02-21 09:30:00   -0.038216
2017-02-22 09:30:00   -0.671159
Freq: D, dtype: float64
# 可以在创建的时候直接赋值 tz=?
In [15]: pd.date_range('2/19/2017 9:30', periods=4, freq='D', tz='UTC')
Out[15]:
DatetimeIndex(['2017-02-19 09:30:00+00:00', '2017-02-20 09:30:00+00:00',
               '2017-02-21 09:30:00+00:00', '2017-02-22 09:30:00+00:00'],
              dtype='datetime64[ns, UTC]', freq='D')

# 从naive到有时区,使用tz_localize
In [16]: tz_utc = ts.tz_localize('UTC')

In [17]: tz_utc
Out[17]:
2017-02-19 09:30:00+00:00    0.530722
2017-02-20 09:30:00+00:00    1.459262
2017-02-21 09:30:00+00:00   -0.038216
2017-02-22 09:30:00+00:00   -0.671159
Freq: D, dtype: float64

In [18]: tz_utc.index.tz
Out[18]: <UTC>

# 使用 tz_convert进行修改时区
In [20]: tz_utc.tz_convert('Asia/Shanghai')
Out[20]:
2017-02-19 17:30:00+08:00    0.530722
2017-02-20 17:30:00+08:00    1.459262
2017-02-21 17:30:00+08:00   -0.038216
2017-02-22 17:30:00+08:00   -0.671159
Freq: D, dtype: float64
4.2 Timestamp对象
# 创建一个Timestamp对象
In [25]: stamp = pd.Timestamp('2017-2-19 12:10')

# naive to utc
In [26]: stamp_utc = stamp.tz_localize('UTC')

# 转换
In [29]: stamp_cn = stamp_utc.tz_convert('Asia/Shanghai')


#  value 显示从unix纪元(1970.1.1)开始计算的纳秒数
In [30]: stamp_utc.value
Out[30]: 1487506200000000000

In [31]: stamp_cn.value
Out[31]: 1487506200000000000

In [32]: stamp.value  # 三个都是一样的
Out[32]: 1487506200000000000
4.3 不同时区之间的运算
不同时区之间的运算最终都转换成了UTC,因为实际存储中都是以UTC时区来存储的。
In [33]: ts
Out[33]:
2017-02-19 09:30:00    0.530722
2017-02-20 09:30:00    1.459262
2017-02-21 09:30:00   -0.038216
2017-02-22 09:30:00   -0.671159
Freq: D, dtype: float64

In [34]: ts.index
Out[34]:
DatetimeIndex(['2017-02-19 09:30:00', '2017-02-20 09:30:00',
               '2017-02-21 09:30:00', '2017-02-22 09:30:00'],
              dtype='datetime64[ns]', freq='D')

In [35]: ts1 = ts[:2].tz_localize('Europe/London')

In [36]: ts2 = ts1.tz_convert('Europe/Moscow')

In [37]: result = ts1 + ts2  # ts1和ts2在不同的时区

In [38]: result.index  # 结果都转变为了UTC
Out[38]: DatetimeIndex(['2017-02-19 09:30:00+00:00', '2017-02-20 09:30:00+00:00'], dtype='datetime64[ns, UTC]', freq='D')

In [39]: result
Out[39]:
2017-02-19 09:30:00+00:00    1.061445
2017-02-20 09:30:00+00:00    2.918524
Freq: D, dtype: float64
5. 时期及算术运算
period(时期)表示时间区间,如数日、数月等。
In [4]: p = pd.Period(2017)

In [5]: p
Out[5]: Period('2017', 'A-DEC')

In [6]: p + 1
Out[6]: Period('2018', 'A-DEC')

In [7]: pd.Period(2018) - p
Out[7]: 1

In [8]: rng = pd.period_range('1/1/2001','6/30/2001', freq='M')

In [9]: rng
Out[9]: PeriodIndex(['2001-01', '2001-02', '2001-03', '2001-04', '2001-05', '2001-06'], dtype='int64', freq='M')

In [10]: Series(np.random.randn(6), index=rng)
Out[10]:
2001-01    1.146489
2001-02    2.112800
2001-03    0.292746
2001-04   -0.841383
2001-05   -0.845565
2001-06    1.207504
Freq: M, dtype: float64


# 列表
In [11]: values = ['2001Q3','2002Q2','2003Q1']

In [13]: index = pd.PeriodIndex(values, freq='Q-DEC') # 以DEC月份作为年度最后一天,来计算季度

In [14]: index
Out[14]: PeriodIndex(['2001Q3', '2002Q2', '2003Q1'], dtype='int64', freq='Q-DEC')

In [26]: index.asfreq('Q-JUN') # 修改一下
Out[26]: PeriodIndex(['2002Q1', '2002Q4', '2003Q3'], dtype='int64', freq='Q-JUN')
5.1 period的频率转换
In [15]: p
Out[15]: Period('2017', 'A-DEC') # 按年取,取一年,年尾是12年31日

In [16]: p.asfreq('M', how='start')  #
Out[16]: Period('2017-01', 'M')

In [17]: p.asfreq('M', how='end')
Out[17]: Period('2017-12', 'M')

In [18]: p = pd.Period('2017',freq='A-JUN') # 取2017年,以7月底为年终

In [19]: p.asfreq('M',how='end')
Out[19]: Period('2017-06', 'M')

In [20]: rng = pd.period_range('2006','2009',freq='A-DEC')  # 取6-9的每年

In [21]: ts = Series(np.random.randn(len(rng)), index=rng)

In [22]: ts
Out[22]:
2006   -0.627032
2007   -1.409714
2008    0.072737
2009    1.240899
Freq: A-DEC, dtype: float64

In [23]: ts.asfreq('M', how='start')  # 按月取,取第一个月
Out[23]:
2006-01   -0.627032
2007-01   -1.409714
2008-01    0.072737
2009-01    1.240899
Freq: M, dtype: float64

In [24]: ts.asfreq('B', how='end')  # 修改频率到天,并取最后一天
Out[24]:
2006-12-29   -0.627032
2007-12-31   -1.409714
2008-12-31    0.072737
2009-12-31    1.240899
Freq: B, dtype: float64

5.2 按季度计算的时期频率
In [28]: rng = pd.period_range('2011Q3','2012Q4',freq='Q-JAN')

In [29]: rs = Series(np.arange(len(rng)), index=rng)

In [30]: new_rng = (rng.asfreq('B','e') - 1).asfreq('T','s') + 16*60

In [35]: rs.index = new_rng.to_timestamp()

In [36]: rs
Out[36]:
2010-10-28 16:00:00    0
2011-01-28 16:00:00    1
2011-04-28 16:00:00    2
2011-07-28 16:00:00    3
2011-10-28 16:00:00    4
2012-01-30 16:00:00    5
dtype: int64
5.3 将timestamp和period进行转换
In [38]: rng = pd.date_range('1/1/2001', periods=3, freq='M')

In [40]: ts = Series(np.random.randn(3), index=rng)

In [41]: pts = ts.to_period()  # 转换成时期

In [42]: ts
Out[42]:
2001-01-31    0.619856
2001-02-28   -2.117066
2001-03-31    1.152329
Freq: M, dtype: float64

In [43]: pts
Out[43]:
2001-01    0.619856
2001-02   -2.117066
2001-03    1.152329
Freq: M, dtype: float64


In [45]: pts.to_timestamp(how='end')  # 转换成时间戳
Out[45]:
2001-01-31    0.619856
2001-02-28   -2.117066
2001-03-31    1.152329
Freq: M, dtype: float64
5.4 通过数据创建PeriodIndex
In [47]: q = Series(range(1,5) * 7)  # 创建季度

In [48]: y = Series(np.arange(1988,2016))  # 创建年份

In [49]: index = pd.PeriodIndex(year=y,quarter=q, freq='Q-DEC')  # 创建index

In [50]: data = Series(np.random.randn(28), index=index)

In [51]: data
Out[51]:
1988Q1   -0.127187
1989Q2   -1.757196
1990Q3    0.826757
...
2013Q2    0.540955
2014Q3    0.531101
2015Q4    0.751739
Freq: Q-DEC, dtype: float64
6. 重采样及频率转换
重采样(resample)表示将时间序列的频率进行转换的过程。可以分为降采样和升采样等。
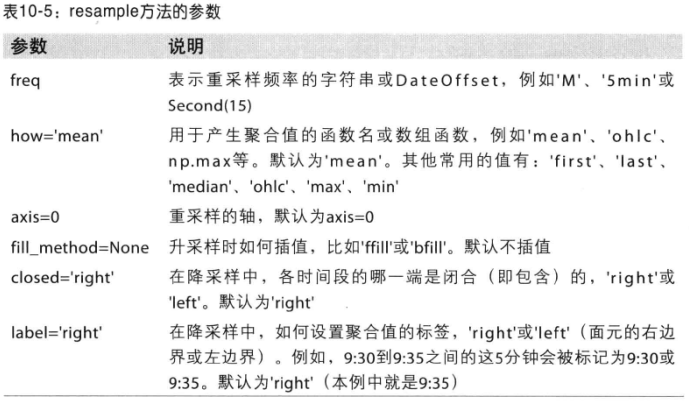
pandas对象都有一个resample方法,可以进行频率转换。
In [5]: rng = pd.date_range('1/1/2000', periods=100, freq='D')

In [6]: ts = Series(np.random.randn(len(rng)), index=rng)
# 聚合后的值如何处理,使用mean(),默认即为mean,也可以使用sum,min等。
In [8]: ts.resample('M').mean()
Out[8]:
2000-01-31   -0.128802
2000-02-29    0.179255
2000-03-31    0.055778
2000-04-30   -0.736071
Freq: M, dtype: float64

In [9]: ts.resample('M', kind='period').mean()
Out[9]:
2000-01   -0.128802
2000-02    0.179255
2000-03    0.055778
2000-04   -0.736071
Freq: M, dtype: float64
6.1 降采样
# 12个每分钟 的采样
In [10]: rng = pd.date_range('1/1/2017', periods=12, freq='T')

In [11]: ts = Series(np.arange(12), index=rng)

In [12]: ts
Out[12]:
2017-01-01 00:00:00     0
2017-01-01 00:01:00     1
2017-01-01 00:02:00     2
...
2017-01-01 00:08:00     8
2017-01-01 00:09:00     9
2017-01-01 00:10:00    10
2017-01-01 00:11:00    11
Freq: T, dtype: int32

# 每隔五分钟采用,并将五分钟内的值求和,赋值到新的Series中。
# 默认 [0,4),前闭后开
In [14]: ts.resample('5min').sum()
Out[14]:
2017-01-01 00:00:00    10
2017-01-01 00:05:00    35
2017-01-01 00:10:00    21
Freq: 5T, dtype: int32

# 默认 closed就是left,
In [15]: ts.resample('5min', closed='left').sum()
Out[15]:
2017-01-01 00:00:00    10
2017-01-01 00:05:00    35
2017-01-01 00:10:00    21
Freq: 5T, dtype: int32

# 调整到右闭左开后,但是时间取值还是left
In [16]: ts.resample('5min', closed='right').sum()
Out[16]:
2016-12-31 23:55:00     0
2017-01-01 00:00:00    15
2017-01-01 00:05:00    40
2017-01-01 00:10:00    11
Freq: 5T, dtype: int32

# 时间取值也为left,默认
In [17]: ts.resample('5min', closed='left', label='left').sum()
Out[17]:
2017-01-01 00:00:00    10
2017-01-01 00:05:00    35
2017-01-01 00:10:00    21
Freq: 5T, dtype: int32
还可以调整offset
# 向前调整1秒
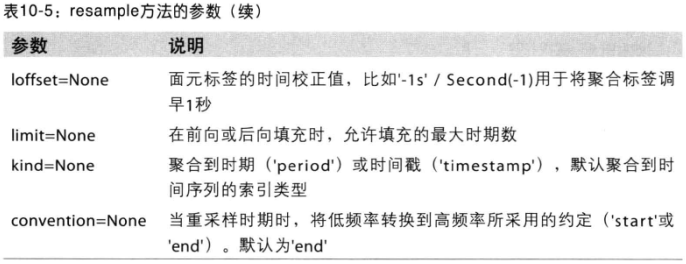
In [18]: ts.resample('5T', loffset='1s').sum()
Out[18]:
2017-01-01 00:00:01    10
2017-01-01 00:05:01    35
2017-01-01 00:10:01    21
Freq: 5T, dtype: int32
OHLC重采样
金融领域有一种ohlc重采样方式,即开盘、收盘、最大值和最小值。
In [19]: ts.resample('5min').ohlc()
Out[19]:
                     open  high  low  close
2017-01-01 00:00:00     0     4    0      4
2017-01-01 00:05:00     5     9    5      9
2017-01-01 00:10:00    10    11   10     11
利用groupby进行重采样
In [20]: rng = pd.date_range('1/1/2017', periods=100, freq='D')

In [21]: ts = Series(np.arange(100), index=rng)

In [22]: ts.groupby(lambda x: x.month).mean()
Out[22]:
1    15.0
2    44.5
3    74.0
4    94.5
dtype: float64

In [23]: rng[0]
Out[23]: Timestamp('2017-01-01 00:00:00', offset='D')

In [24]: rng[0].month
Out[24]: 1

In [25]: ts.groupby(lambda x: x.weekday).mean()
Out[25]:
0    50.0
1    47.5
2    48.5
3    49.5
4    50.5
5    51.5
6    49.0
dtype: float64
6.2 升采样和插值
低频率到高频率的时候就会有缺失值,因此需要进行插值操作。
In [26]: frame = DataFrame(np.random.randn(2,4), index=pd.date_range('1/1/2017'
    ...: , periods=2, freq='W-WED'), columns=['Colorda','Texas','NewYork','Ohio
    ...: '])

In [27]: frame
Out[27]:
             Colorda     Texas   NewYork      Ohio
2017-01-04  1.666793 -0.478740 -0.544072  1.934226
2017-01-11 -0.407898  1.072648  1.079074 -2.922704

In [28]: df_daily = frame.resample('D')

In [30]: df_daily = frame.resample('D').mean()

In [31]: df_daily
Out[31]:
             Colorda     Texas   NewYork      Ohio
2017-01-04  1.666793 -0.478740 -0.544072  1.934226
2017-01-05       NaN       NaN       NaN       NaN
2017-01-06       NaN       NaN       NaN       NaN
2017-01-07       NaN       NaN       NaN       NaN
2017-01-08       NaN       NaN       NaN       NaN
2017-01-09       NaN       NaN       NaN       NaN
2017-01-10       NaN       NaN       NaN       NaN
2017-01-11 -0.407898  1.072648  1.079074 -2.922704


In [33]: frame.resample('D', fill_method='ffill')
C:\Users\yangfl\Anaconda3\Scripts\ipython-script.py:1: FutureWarning: fill_metho
d is deprecated to .resample()
the new syntax is .resample(...).ffill()
  if __name__ == '__main__':
Out[33]:
             Colorda     Texas   NewYork      Ohio
2017-01-04  1.666793 -0.478740 -0.544072  1.934226
2017-01-05  1.666793 -0.478740 -0.544072  1.934226
2017-01-06  1.666793 -0.478740 -0.544072  1.934226
2017-01-07  1.666793 -0.478740 -0.544072  1.934226
2017-01-08  1.666793 -0.478740 -0.544072  1.934226
2017-01-09  1.666793 -0.478740 -0.544072  1.934226
2017-01-10  1.666793 -0.478740 -0.544072  1.934226
2017-01-11 -0.407898  1.072648  1.079074 -2.922704

In [34]: frame.resample('D', fill_method='ffill', limit=2)
C:\Users\yangfl\Anaconda3\Scripts\ipython-script.py:1: FutureWarning: fill_metho
d is deprecated to .resample()
the new syntax is .resample(...).ffill(limit=2)
  if __name__ == '__main__':
Out[34]:
             Colorda     Texas   NewYork      Ohio
2017-01-04  1.666793 -0.478740 -0.544072  1.934226
2017-01-05  1.666793 -0.478740 -0.544072  1.934226
2017-01-06  1.666793 -0.478740 -0.544072  1.934226
2017-01-07       NaN       NaN       NaN       NaN
2017-01-08       NaN       NaN       NaN       NaN
2017-01-09       NaN       NaN       NaN       NaN
2017-01-10       NaN       NaN       NaN       NaN
2017-01-11 -0.407898  1.072648  1.079074 -2.922704

In [35]: frame.resample('W-THU', fill_method='ffill')
C:\Users\yangfl\Anaconda3\Scripts\ipython-script.py:1: FutureWarning: fill_metho
d is deprecated to .resample()
the new syntax is .resample(...).ffill()
  if __name__ == '__main__':
Out[35]:
             Colorda     Texas   NewYork      Ohio
2017-01-05  1.666793 -0.478740 -0.544072  1.934226
2017-01-12 -0.407898  1.072648  1.079074 -2.922704

In [38]: frame.resample('W-THU').ffill()
Out[38]:
             Colorda     Texas   NewYork      Ohio
2017-01-05  1.666793 -0.478740 -0.544072  1.934226
2017-01-12 -0.407898  1.072648  1.079074 -2.922704
6.3 通过时期(period)进行重采样
# 创建一个每月随机数据,两年
In [41]: frame = DataFrame(np.random.randn(24,4), index=pd.date_range('1-2017',
    ...: '1-2019', freq='M'), columns=['Colorda','Texas','NewYork','Ohio'])

# 每年平均值进行重采样
In [42]: a_frame = frame.resample('A-DEC').mean()

In [43]: a_frame
Out[43]:
             Colorda     Texas   NewYork      Ohio
2017-12-31 -0.441948 -0.040711  0.036633 -0.328769
2018-12-31 -0.121778  0.181043 -0.004376  0.085500

# 按季度进行采用
In [45]: a_frame.resample('Q-DEC').ffill()
Out[45]:
             Colorda     Texas   NewYork      Ohio
2017-12-31 -0.441948 -0.040711  0.036633 -0.328769
2018-03-31 -0.441948 -0.040711  0.036633 -0.328769
2018-06-30 -0.441948 -0.040711  0.036633 -0.328769
2018-09-30 -0.441948 -0.040711  0.036633 -0.328769
2018-12-31 -0.121778  0.181043 -0.004376  0.085500

In [49]: frame.resample('Q-DEC').mean()
Out[49]:
             Colorda     Texas   NewYork      Ohio
2017-03-31 -0.445315  0.488191 -0.543567 -0.459284
2017-06-30 -0.157438 -0.680145  0.295301 -0.118013
2017-09-30 -0.151736  0.092512  0.684201 -0.035097
2017-12-31 -1.013302 -0.063404 -0.289404 -0.702681
2018-03-31  0.157538 -0.175134 -0.548305  0.609768
2018-06-30 -0.231697 -0.094108  0.224245 -0.151958
2018-09-30 -0.614219  0.308801 -0.205952  0.154302
2018-12-31  0.201266  0.684613  0.512506 -0.270111
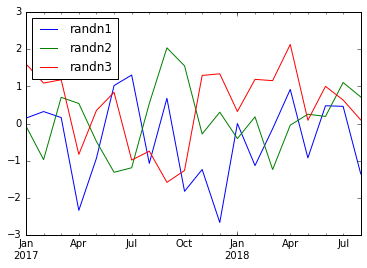
7. 时间序列绘图
import numpy as np
import matplotlib.pyplot as plt
import pandas as pd
from pandas import Series,DataFrame

frame = DataFrame(np.random.randn(20,3),
                  index = pd.date_range('1/1/2017', periods=20, freq='M'),
                columns=['randn1','randn2','randn3']
                )
frame.plot()
8. 移动窗口函数
待续。。。
9. 性能和内存使用方面的注意事项
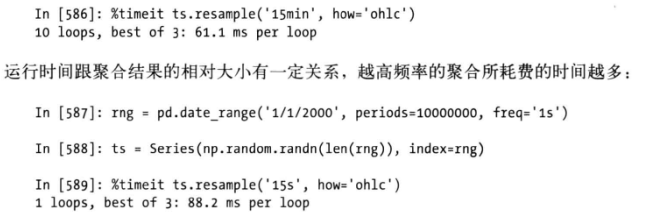
In [50]: rng = pd.date_range('1/1/2017', periods=10000000, freq='1s')

In [51]: ts = Series(np.random.randn(len(rng)), index=rng)

In [52]: %timeit ts.resample('15s').ohlc()
1 loop, best of 3: 222 ms per loop

In [53]: %timeit ts.resample('15min').ohlc()
10 loops, best of 3: 152 ms per loop
貌似现在还有所下降。
